Why Are Fewer Twin Cities Buyers Looking at Homes Under $400,000?
Something interesting showed up in the latest Twin Cities housing data.
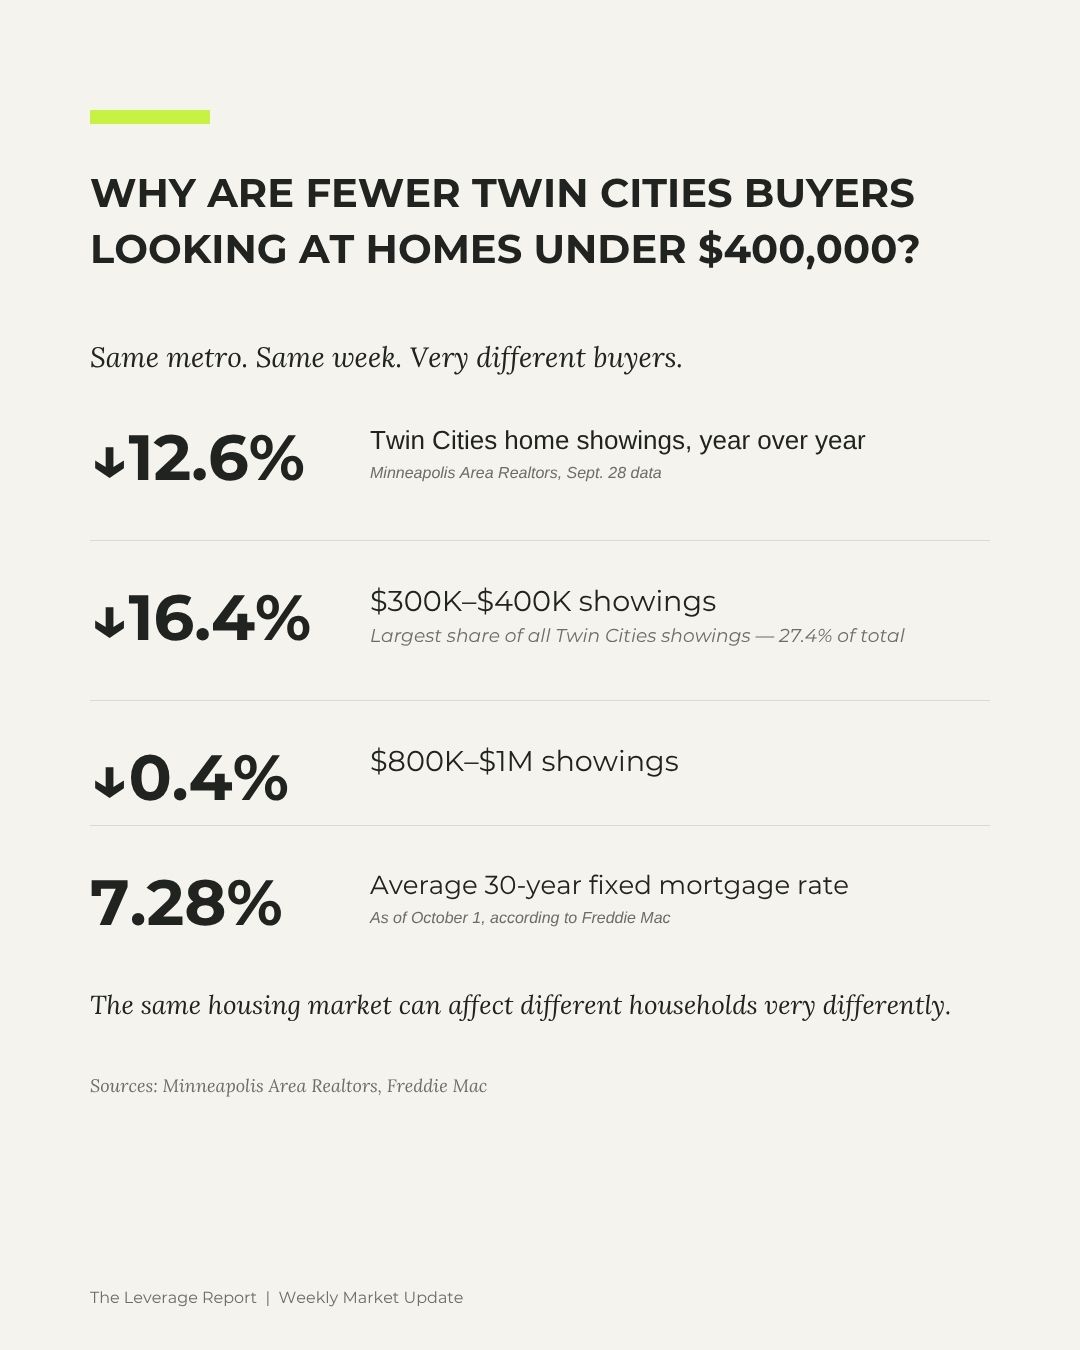
Home showings across the metro were down 12.6% from a year ago last week.
But look at where showing activity fell:
Homes priced $300,000-$400,000: -16.4%
Homes priced $800,000-$1 million: -0.4%
Same metro.
Same week.
Very different buyers.
So what's going on?
The data don't prove one single cause. But there's an important possibility worth understanding:
Affordability may be hitting buyers at the lower end of the market harder.
And if you're thinking about buying or selling a home in the Twin Cities, that matters.
Are fewer Twin Cities buyers shopping for homes right now?
Yes.
According to the latest Minneapolis Area Realtors data, home-showing activity across the Twin Cities was 12.6% lower than the same week last year.
Every price range experienced fewer showings.
But the declines weren't evenly distributed.
Homes priced between $300,000 and $400,000 saw showings fall 16.4%.
Meanwhile, showing activity for homes between $800,000 and $1 million was down just 0.4%.
There's another important piece:
The $300,000-$400,000 range still accounted for 27.4% of all showings, the largest share of any price category.
So buyers haven't abandoned that part of the market.
Far from it.
It's still where a huge amount of Twin Cities buyer activity is happening.
There are simply fewer showings happening there than there were a year ago.
Why might lower-priced homes be seeing a bigger slowdown?
This is where we need to separate what the data tell us from what might explain it.
The showing data tell us that activity has fallen more sharply in the $300,000-$400,000 range than in the $800,000-$1 million range.
They do not tell us why.
But affordability is an important place to look.
As of October 1, Freddie Mac reported the average 30-year fixed mortgage rate at 7.28%.
That's up from 7.03% just one week earlier.
When borrowing costs move that quickly, the monthly payment can change even though the house and its asking price haven't changed at all.
And for a buyer whose budget is already tight, there may simply be less room to absorb it.
What does a higher mortgage rate actually do to a buyer's payment?
Here's a simple example.
On a $300,000 mortgage, principal and interest at a 6.5% rate is roughly:
$1,896 per month.
At 7.0%:
$1,996 per month.
At 7.5%:
$2,098 per month.
That's about a $200 monthly difference between 6.5% and 7.5%, before adding property taxes, homeowners insurance, mortgage insurance or HOA dues.
The house didn't change.
The amount borrowed didn't change.
The cost of financing it did.
That's why mortgage rates don't just affect what buyers want to pay.
They affect what buyers can comfortably afford each month.
Why might that affect a $350,000 buyer differently than a $900,000 buyer?
This is the part I think housing headlines often miss.
Two buyers can experience the exact same mortgage-rate environment very differently.
A household shopping around $350,000 may already be working within a tight monthly budget.
Maybe they're balancing:
Daycare.
Car payments.
Student loans.
Property taxes.
Homeowners insurance.
And everything else their household needs each month.
Add another $100 or $200 to the housing payment and the question may stop being:
“Do we like this house?”
It may become:
“Can we still comfortably afford to do this?”
A higher-income household shopping at $900,000 isn't immune to higher rates.
Their payment can increase by considerably more dollars.
But they may have more flexibility in their budget, more cash available, a larger down payment or other financing options.
That won't be true for every buyer.
But it helps explain why the same change in the market can affect different buyers very differently.
Does this mean buyers under $400,000 have stopped buying?
No.
And this is important.
The $300,000-$400,000 range still represents the largest share of Twin Cities home showings.
Buyers are there.
The market is active.
The latest data simply suggest that there are fewer of those shopping trips happening than there were a year ago.
That distinction matters.
Because “buyer activity is slowing” and “there are no buyers” are two very different statements.
What does this mean if you're buying a Twin Cities home?
If you're shopping in the $300,000-$400,000 range, there may be a strange tradeoff happening.
Higher borrowing costs can make the monthly payment harder.
But fewer competing buyers can sometimes create more negotiating leverage on the right property.
That could mean opportunities around:
Price.
Seller-paid closing costs.
Repairs.
Closing date.
Or potentially a seller contribution that helps reduce the buyer's financing cost.
But none of those automatically make a house affordable.
A negotiated deal is only a good deal if the payment still works for you.
That's why I'd start with the monthly number you're actually comfortable carrying, not simply the maximum purchase price you've been approved for.
Then evaluate the opportunity around each individual house.
What does this mean if you're selling a home under $400,000?
Don't read this data as:
“Nobody is buying homes under $400,000.”
That's clearly not what the numbers say.
This price range still receives more showings than any other.
But buyers in this segment may be particularly sensitive to the total cost of owning the home.
That means a seller shouldn't only ask:
“What price can I get?”
I'd also be thinking about:
How does my home compare with the buyer's alternatives?
What will the monthly payment look like?
Are there repairs that could scare off a buyer already stretching their budget?
Could a concession sometimes be more valuable to a buyer than the same amount taken off the purchase price?
And is the home positioned well enough that buyers feel it's worth stretching for?
The buyer may still want your house.
The bigger question may be whether the numbers allow them to buy it.
Are mortgage rates causing the slowdown?
We don't know that from this data alone.
That's worth saying plainly.
Showing activity can change because of seasonality, inventory, consumer confidence, economic uncertainty, prices, mortgage rates and plenty of other factors.
One week of showing data also doesn't establish a long-term trend.
But with the average 30-year mortgage rate now at 7.28%, affordability is an increasingly important part of the conversation.
When showing activity is falling much faster in one price range than another at the same time borrowing costs are elevated, it's worth paying attention to how affordability may be affecting different buyers.
The bottom line
The latest Twin Cities showing data reveal something more useful than simply saying “buyer activity is down.”
Overall home showings were down.
But they were down 16.4% for homes priced $300,000-$400,000 and only 0.4% for homes priced $800,000-$1 million.
That doesn't prove higher mortgage rates caused the difference.
But it does highlight something every buyer and seller should understand:
The same housing market can affect different households very differently.
For buyers, affordability isn't simply the price written on the listing.
It's the monthly cost of actually owning the home.
For sellers, demand isn't simply about whether somebody likes the house.
It's also about whether the buyers who want it can make the numbers work.
And right now, understanding that difference may tell us more than another headline about whether “the market” is up or down.
Twin Cities Home Affordability FAQ
Are fewer buyers looking at Twin Cities homes in 2026?
Yes, according to the latest weekly showing data. Minneapolis Area Realtors reported Twin Cities home-showing activity 12.6% lower than the same week a year earlier. However, the decline varied substantially by price range.
Are homes under $400,000 still getting buyer interest?
Yes. Homes priced from $300,000-$400,000 accounted for 27.4% of Twin Cities showings, the largest share of any price category in the latest data. However, showing activity in that range was 16.4% lower than a year earlier.
What is the current average 30-year mortgage rate?
Freddie Mac reported that the average 30-year fixed mortgage rate was 7.28% as of October 1, 2026, up from 7.03% the previous week.
Are mortgage rates causing Twin Cities buyer activity to slow?
Mortgage rates may be contributing to affordability pressure, but the showing data alone cannot establish that they caused the decline. Seasonality, inventory, consumer confidence, home prices and broader economic conditions can also affect buyer activity.
How do mortgage rates affect home affordability?
A higher mortgage rate increases the monthly cost of borrowing the same amount of money. On a $300,000 30-year mortgage, principal and interest would be approximately $1,896 per month at 6.5%, $1,996 at 7.0%, and $2,098 at 7.5%. Taxes, insurance and other housing costs would be additional.
Does slower buyer activity mean Twin Cities sellers need to lower their price?
Not necessarily. Buyer demand varies by location, price, property type and the individual home. Sellers should evaluate the competing homes available to their likely buyers rather than assuming a metro-wide trend applies equally to their property.
Sources: Minneapolis Area Realtors, The Weekly Pulse, September 28, 2026. Freddie Mac, Primary Mortgage Market Survey, October 1, 2026.